Ask anyone in Islamabad how July felt and you'll hear the same thing: wet. Grey skies, a few dramatic downpours, flooded underpasses. Yet at our G-8/2 automatic weather station, the gauge recorded just 244.0 mm of rain for the month roughly 49% below the station's 2022–2025 July average of 480.9 mm, and the lowest July total in the five years we've been measuring.
How can a month feel so wet and measure so dry? The answer is in the shape of the rainfall, not just the sum of it.
Five Julys, side by side
Taken year by year, 2026 is the clear outlier on the low side. Every recent July out-rained it even 2024, the next-driest, edged ahead. At the other end, 2025 delivered more than two and a half times as much rain as this year.
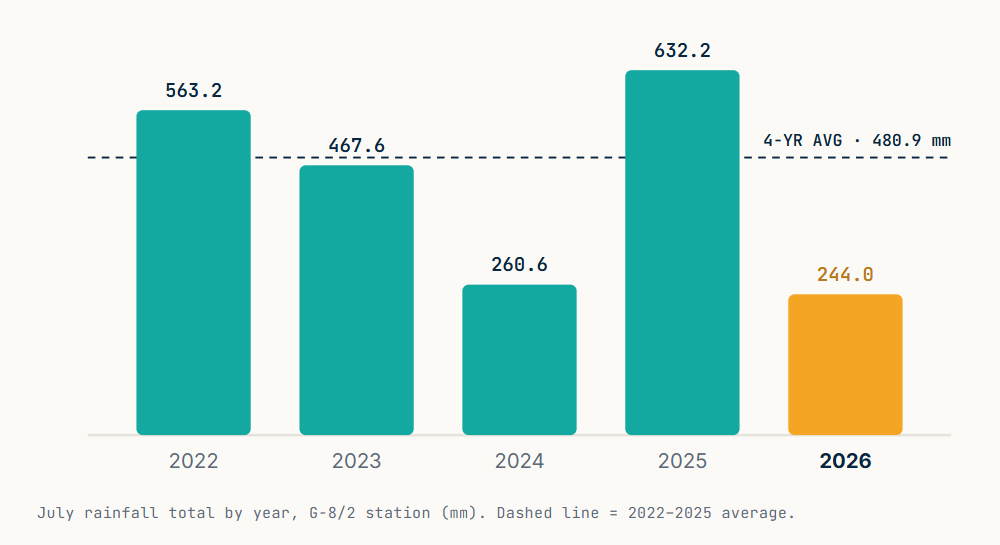
July rainfall total by year, G-8/2 station (mm). Dashed line = 2022–2025 average.
Fewer wet days and no big soaker
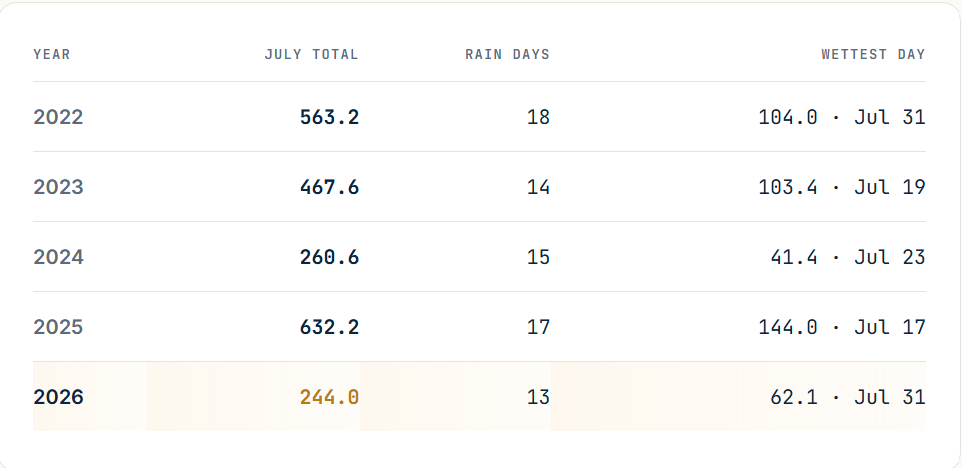
Two things separate a dry July from a wet one here, and 2026 fell short on both. It rained on only 13 days, the fewest of any July in the record. And crucially, it never produced a heavy soaking event: the wettest single day topped out at 62.1 mm. In every wet July before it, one day alone cleared 100 mm 2025 peaked at a remarkable 144 mm in twenty-four hours.
How the rain actually fell
Plotting every day of the month makes the pattern obvious. Most of July was dry. What rain there was arrived in a couple of short bursts chiefly the spells around 21 and 31 July with long quiet gaps in between. Those bursts are what made the month feel wet, even as the running total stayed low.
The concentration is striking: the five wettest days together delivered about 79% of the entire month's rain. Strip those out and the remaining three-plus weeks contributed barely 50 mm between them.

What it means
July 2026's shortfall wasn't caused by one storm that missed the city. The month simply rained less often, and when it did rain, it never came down hard enough to close the gap. A handful of memorable downpours shaped the perception; the long dry stretches shaped the total.

It's a useful reminder of why continuous, station-level measurement matters. A few dramatic days can leave a strong impression while the season quietly runs well below par. Only the gauge — logging every minute, every day — tells you which it was.